Building An
Intelligent Software Robot
Capable of Learning
UiPath-RPA-Machine-Learning-Workbook-02
“Machine Learning”
|
Document
Name |
UiPath-RPA-Machine-Learning-Workbook-02 |
|
Version |
DRAFT |
|
Date |
20 January 2020 |
|
Author |
Tony Nudd |
The following tutorial, for Students who are 14-years-old and above, will describe the steps necessary to create an Artificial Intelligence based software robot capable of making decisions based on machine learning techniques.
The workshop is in two parts, this is Part Two
All subsequent workshops build from Part One, you must
have completed Part 1 before strating this workshop.
Estimated time to complete this
workshop is no more than 2 hours
· A detailed training guide for UiPath RPA (Robotic Process Automation)
· A detailed training guide for Python programming
· A detailed training guide for Machine Learning
· Written for experts
· A step-by-step taster of combining Robotic Process Automation and Machine Learning using UiPath and Python
· A quick introduction to some of the concepts and features of UiPath RPA
· A quick introduction to some of the concepts and features of Python
· A quick introduction to some of the concepts and features of Machine Learning
· A hands-on quick build workshop using some very cool software technologies
· Written for people who just want to get hands-on without too much detailed theory.
· Aimed at 14 years of age and over, who have some interest and experience with computers, and preferably, some coding knowledge (but not necessary)
· PC/Laptop with Windows10 installed
· Permissions to install software on your PC/Laptop
· Permissions to run the Windows Command Prompt
· Internet connection available during some of the activities
You
need to bring a mix of curiosity and a willingness to learn something new.
IMPORTANT:
Screenshots and images in these workbooks were correct at
the time of writing, however new editions and updates of the software you will
be using means when you perform an activity results may look slightly
different to the images displayed in these workbooks.
Throughout out the workbook the following
sections will be encountered:
|
|
What will be covered in this section |

This is a general introduction to the section and the estimated time it takes to complete
|
|
What you will learn |

This is a summary of what will be covered
|
|
Why you need to know it |

This explains why it may be important
|
|
Let’s Get Started |
This is where you actually do the activities
|
|
What was covered in this section |
This is a re-cap of what you just covered
|
|
Test your knowledge |

Here are some pop-quiz questions to test what you have just covered.
|
|
Interesting
Fact This section
gives an interesting computer related fact. |
Contents
Introduction to AI, ML,
Python & RPA (recap)
See finished robot PROJECT
in action
The Intelligent Robot You
Will Build
Create a copy of an
existing project
Project Folder Locations -
Reminder
Edit the existing robot
process
Looking Up Data From A CSV
File
Calling the ml function in
uipath
Your guide
|
|
Tony is a Robotics Imaginator and he work at UiPath. Originally from the UK, Tony now lives in Australia. Tony has 20+ years’ experience in the Business Automation, workflow and Robotic process Automation space. UiPath is the creator of UiPath Robotic Process Automation (RPA), a technology which automates repetitive computer-based tasks. UiPath RPA can also be used to integrate and automate several software applications together to save valuable time. Tony’s personal RPA projects
with Artificial Intelligence include: ·
Training UiPath Software Robots to
automatically fly a drone to count the items on a shop shelf (stock taking) ·
Controlling UiPath Software Robots using mind
control through an EEG headset ·
Using UiPath Software Robots to identify
visitors at a Video Doorbell by incorporating Facial Recognition
|

|
|
What will be covered in this section |

What are the concepts and components being used to create the workshop Design Environment?
Time: 10 minutes
|
|
What you will learn |
What each software component does in the design environment and why it has been included?
|
|
Why you need to know it |

By understanding what each software application does in the design environment will provide a stronger understanding of the capabilities available to you as a designer.
|
|
Let’s Get Started |
Robotic Process Automation (RPA) is defined by
UiPath as 4:
The technology that allows anyone today to configure computer software, or a “robot” to emulate and integrate the actions of a human interacting within digital systems to execute a business process. RPA robots utilize the user interface to capture data and manipulate applications just like humans do. They interpret, trigger responses and communicate with other systems in order to perform on a vast variety of repetitive tasks. Only substantially better: an RPA software robot never sleeps and makes zero mistakes.
Artificial Intelligence (AI) is defined in
the Merriam-Webster dictionary1 as:
A branch of computer science dealing with the
simulation of intelligent behaviour in computers.
The capability of a machine to imitate intelligent
human behaviour.
Machine Learning
(ML) is defined in the Merriam-Webster dictionary2 as:
The process by which a computer is able to
improve its own performance (as in analysing image files) by continuously
incorporating new data into an existing statistical model.
Python is defined by
Eureka.co3 as a high-level, interpreted computer software language which has
easy syntax.
High Level
- Python derives components from
the natural language that we humans use to communicate with each other.
This makes it easier for anyone to try and relate what exactly could be
happening without the burden of going through tons of machine code.
Interpreted - Python
codes are compiled and executed by the computer line-by-line which makes debugging errors much easier and
efficient. But this comes at a cost as it is much slower than other programming
languages.
Easy Syntax - Python
makes use of indentations instead of braces to distinguish what blocks of
code come under which class or function. This makes the code look well distributed and makes it easy for anyone to read it.
Intelligent RPA is where the RPA Software Robots can
utilise Artificial Intelligence in order to make decisions and so bring even
more automation to the scenario.
For example, a robot could be designed to move emails from
the general inbox into certain sub-folders based on finding keywords in the
subject line – this would be standard RPA.
Intelligent RPA is where the robot, using Artificial Intelligence, moves the
emails from the general inbox to certain sub-folders based on understanding
the content of the email (using sentiment analysis) just like a human
would.
1 https://www.merriam-webster.com/dictionary/artificial%20intelligence
2 https://www.merriam-webster.com/dictionary/machine%20learning
4 https://www.edureka.co/blog/what-is-python/
4 https://www.uipath.com/rpa/robotic-process-automation
Visit here: TBA
In the video you will see the robot:
· A UiPath robot wake-up
· The UiPath robot will communicate with the user who asks a question
· The UiPath robot will run an Artificial Intelligence routine (via Python code) to determine the best possible answer
· The UiPath robot will deliver the answer to the user
|
|
What was covered in this section |
What each software component does in the design environment and why it has been included?
|
|
Test your knowledge |

1. What do the initials RPA stand for?
2. Describe briefly what a software robot does?
3. What do the initials ML stand for?
4. What is the relationship between ML and AI?
5. What is Python?
6. Describe what iRPA is?
|
|
Interesting
Fact The term
"Software Engineer" is often attributed to Margaret Hamilton (born
August 17, 1936). She later became Director of the Software Engineering
Division of the MIT Instrumentation Laboratory, which developed on-board
flight software for NASA's Apollo space program. |
what is machine learning (ML)
|
|
What will be covered in this section |

What is Machine Learning (ML)
|
|
What you will learn |

How does Machine Learning fit within Artificial Intelligence (AI) and Data Science.
Time: 5 minutes
|
|
Why you need to know it |
Machine Learning is a broad subject, and the activities in this workshop cover just a small part of ML possibilities, so this section gives a broader view of ML.
|
|
Let’s Get Started |
Machine Learning (ML) is commonly used when discussing Artificial Intelligence (AI) but they are not the same thing. ML is a subset of AI. ML refers to systems that can learn by themselves.
Minsky and McCarthy in the 1950’s, described artificial intelligence as “Any task performed by a program or a machine that, if a human carried out the same activity, we would say the human had to apply intelligence to accomplish the task.”
To achieve a level of intelligence as described above, Machine Learning is required by the program or machine.
Machine Learning is still in its early stages.
It has lots of room for further evolution and is an exciting branch of computing.
So how can we define Machine Learning?
Well, there is no one definition, there are, however, a number of statements made which describe machine learning really well.
Francois Chollet, 2017 - Software engineer and AI researcher - Staff Software Engineer at Google “Traditionally, software engineering combined human created rules with data to create answers to a problem. Instead, machine learning uses data and answers to discover the rules behind a problem.”
Arthur Samuel in
1959, an American pioneer in the field of computer gaming and artificial
intelligence and stated that “Machine Learning gives computers the
ability to learn without being explicitly programmed”.
Some examples of where Machine Learning is being used today are:
Prediction — Example: ML is used to determine the
risk of an applicant wanting a bank loan.
Image
recognition — Example:
ML is used to detect and recognise people’s faces.
Speech
Recognition — Example:
ML is used to understand what is being spoken byu a hman and act on the instructions such as automated
telephone answering systems.
Medical
diagnoses — Example:
ML is trained to recognize cancerous tissues in medical pictures.
Finance
& Trade — Example:
ML in fraud investigations and credit checks.
Every day a new use for ML is created.
There are several types of Machine Learning:
Supervised Learning – The ML algorithm learns from given examples (which are also given useful tags), the ML can then predict an answer on new data of a similar kind to that it was trained with.
Unsupervised Learning —The ML algorithm can learn from un-tagged data examples to provide some meaning. An example is giving marketing/product recommendations based on a person’s web searches.
Reinforcement Learning – The algorithm learns from un-tagged data (similar to un-supervised learning) but is also provided with positive or negative feedback.
|
|
What was covered in this section |
How does Machine Learning fit within Artificial intelligence (AI) and Data Science.
What is Machine Learning.
|
|
Test your knowledge |

1.
How
does Machine Learning differ from traditional programming?
2.
Give some examples of where Machine Learning is being
used today?
3.
What is supervised learning?
4.
What is un-supervised learning
5. What is reinforcement Learning?
|
|
Let’s Get Started |
We will start by making a copy of our original MyFirstRobot project.
Your project folder may differ to that shown in this workshop.
Typically we might use: ‘C:\Users\<Your ID>\Documents\UiPath\MyIntelligentRobot'
Where <Your ID> is the your Windows User ID and
will be unique to you.
If you are using OneDrive, your Project Folder may look like this:
‘C:\Users\<Your ID>\Documents\OneDrive\UiPath\MyIntelligentRobot’
So when cutting and pasting code snippets from this
workbook, remember to update the folder locations correctly.
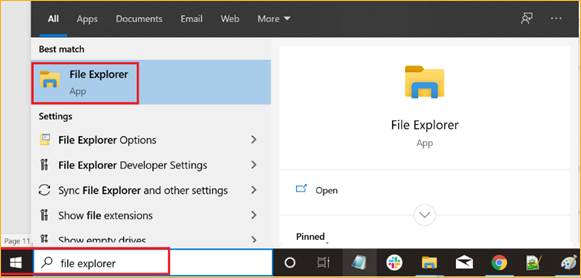
Open File Explorer
Navigate to the UiPath projects folder – where your MyFirstRobot project folder resides.
e.g. C:\Users\<Your ID>\Documents\UiPath or
This PC > Documents > UiPath
(both are same location in Windows)
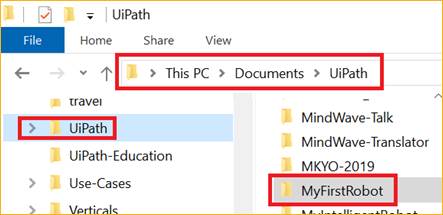
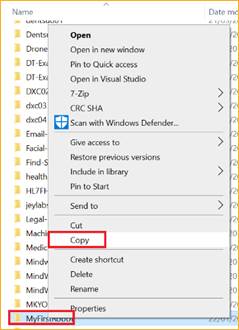
With UiPath selected on the left-hand side and MyFirstRobot folder displayed on the right-hand side,
right-click MyFirstRobot folder name and
select COPY
Then in same right-hand side, right click anywhere and
select PASTE
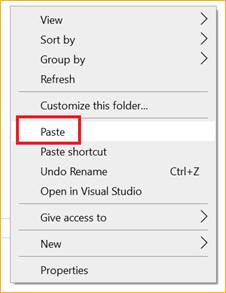
A new entry at the bottom of the right-hand side will appear
called MyFirstRobot – Copy
Righ-click this new file and select RENAME
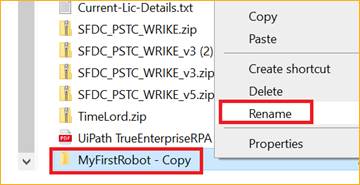
Rename the folder to MyIntelligentRobot

Click outside of the naming box to save your changes.
You have now successfully a copy of your previous project.
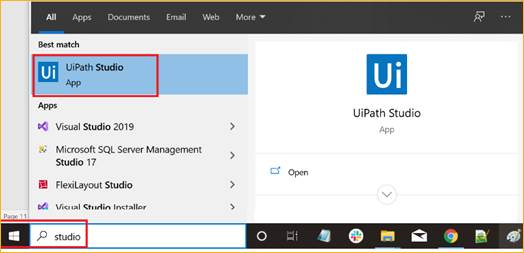
Start UiPath Studio.
Open your new project MyIntelligentRobot – select HOME from the top menu
Select Open a local Project
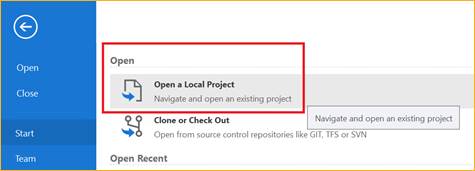
Navigate to your new project folder
e.g. C:\Users\<Your ID>\Documents\UiPath\MyIntelligentRobot
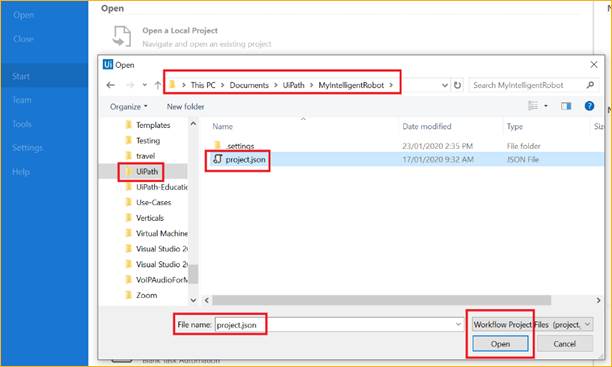
Select the project.json
file and click OPEN

Then click Open Main Workflow
You will then see your project.
You can leave this project open will you create your data
file.
The project scenario is that you have been given some data (as shown below).
The data is the salary of a Software Robotics Engineer based on years of experience.
You will create a CSV (comma separated variable) file to save this data.
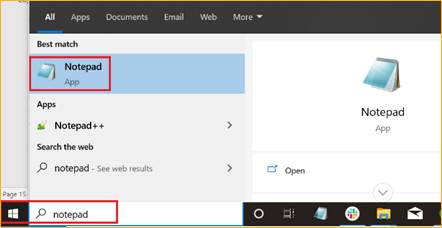
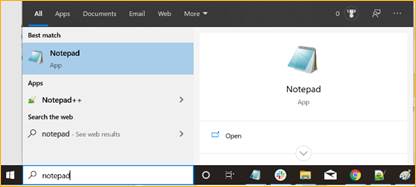
Open Notepad App
In the new file add the following data (including the header words).
You may be able to highlight the data below using your mouse then right-click and select copy
Then in the empty Notepad window left-click click your mouse once, then right-click and select paste
YearsExperience,Salary
1.3,49141.00
1.1,46205.00
1.5,47713.00
2.0,41525.00
2.2,59893.00
2.9,56642.00
3.0,60350.00
3.2,54445.00
3.2,64445.00
3.7,57389.00
3.9,61238.00
4.0,55794.00
4.0,56957.00
4.3,57083.00
4.5,63333.00
4.9,67918.00
5.3,66029.00
5.1,81088.00
5.9,83161.00
6.0,91940.00
6.8,93718.00
7.3,98271.00
7.9,103102.00
8.2,111832.00
8.7,109413.00
9.0,105582.00
9.5,136969.00
9.6,132615.00
10.1,142193.00
10.5,148872.00
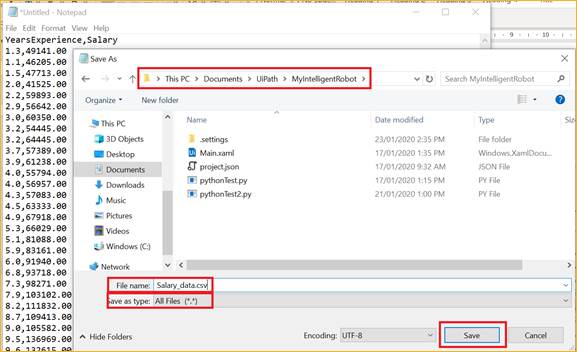
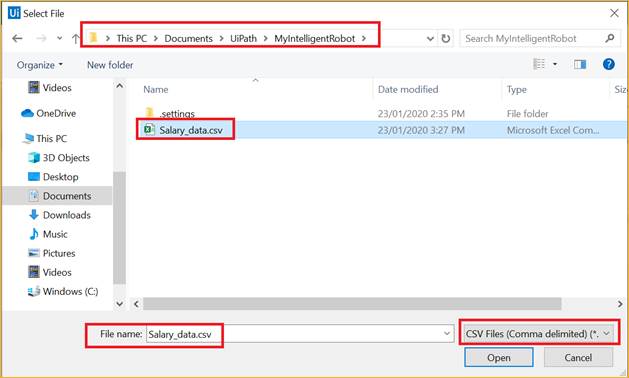
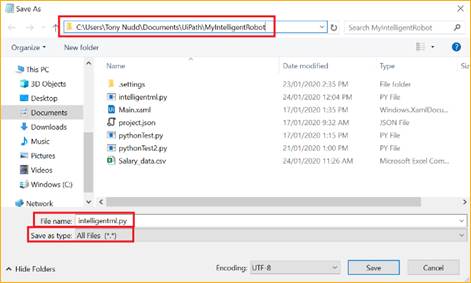
Once all the data is in your Notepad App, select File – Save As
Navigate to your project folder
e.g. C:\Users\Tony Nudd\Documents\UiPath\MyIntelligentRobot
Then save the file as Salary_data.csv
Important: Ensure you select Save as type: *.* as shown in the image below.
In your folder you will see a new file entry
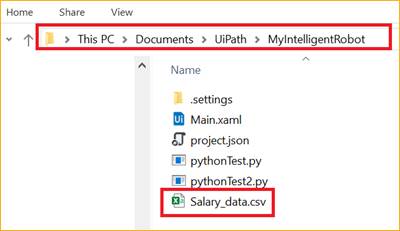
(Your file Salary_data.csv may or may not have the green X icon).
So, what is the in the data file. It is a list of known salaries for years of work experience in the Software Robotics job market.
If you look at the data list, you can see that:
· A person working for 4.0 years could be earning about $55,794 per year.
· A person working for 6.0 years could be earning about $91,940 per year
· A person working 10.5 years could be earning about $183,872 per year
We will now create a Software Robot which can provide this data on request.
|
|
What will be covered in this section |

This is a general introduction to the section and the estimated time it takes to complete
|
|
What you will learn |

·
Reading values from a CSV file
·
Creating code loops using For-Each-Row
· Using the If-Then-Else Activity
Time: 30 minutes
|
|
Why you need to know it |

Being able to quickly change existing Software Robot designs in UiPath Studio is important to allow your project (or the business) respond to ever changing requirements.
The activities used in this section are fundamental and will be used many projects.
|
|
Let’s Get Started |
This is where you actually do the activities
We will now edit the existing project.
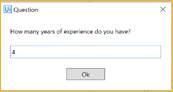
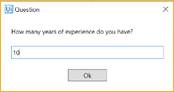
The first thing the process will do is ask the user how many years of experience in Data Science they have.
The user will provide a number (years), so we need a variable to store this value.
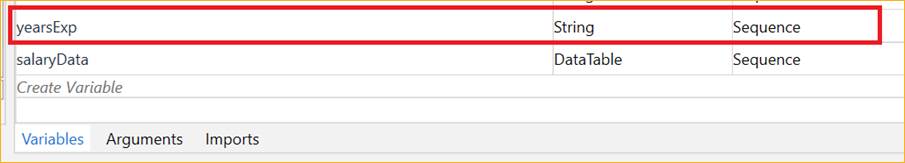
Select the Variable Tab and create a variable called yearsExp and set the type of data as a String.
You can then click the Variable Tab to hide the list.
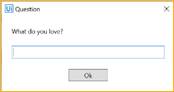
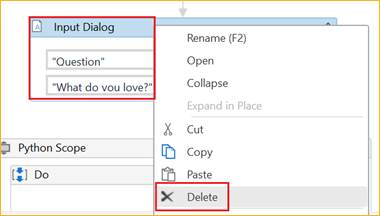
Now we can add an Activity to get information from the user.
Search for an Activity called Input Dialog
Drag the Activity to above the existing Message Box (ie: top of the process)
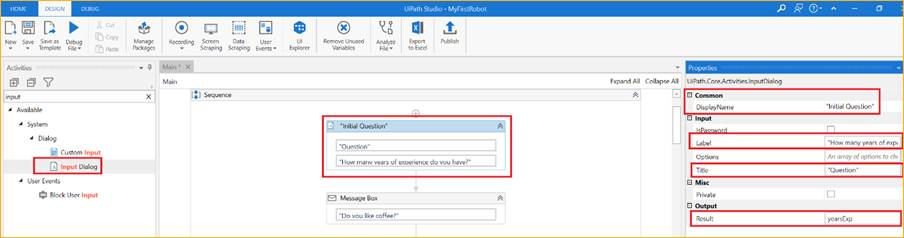
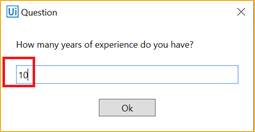
DisplayName: “Initial Question”
Label: “How many
years of experience do you have?”
Title: “Question”
Result: yearsExp Note: Do NOT use quotes here, we are referring to a variable
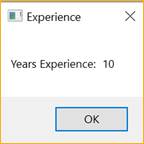
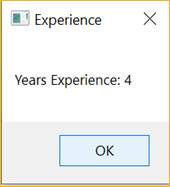
Now we will edit the following Message Box to display the captured Years value (just for testing).
The value we want to see is held in the variable yearsExp
To join text (concatenate) in UiPath we use the “+”
So we will use “Years Experience:
“ + yearsExp in the
display text message.
We are taking some fixed text (in double quotes) and concatenating some more
text to it (held in variable yearsExp).
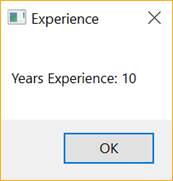
Click on the Message Box
Buttons: OK
Caption: “Experience”
Text: “Years Experience: “ + yearsExp
Now test your changes.
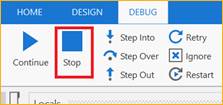
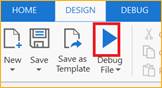
Click the Run Debug button
The white Robot Icon will start after a few seconds.
The User Input box should appear – if not, click on the white Robot Icon and select the User Input Box
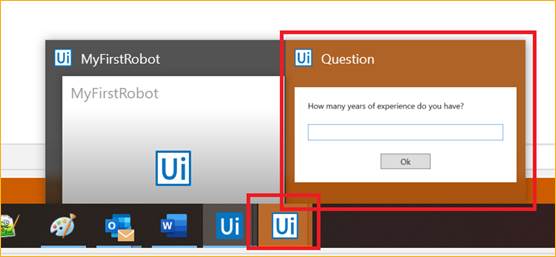
Add a number value in the Input Box e.g. 10 and click OK
The Message Box should then pop up and show it has captured the user’s answer.
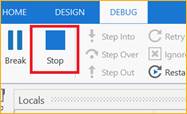
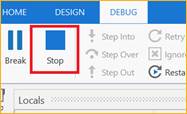
You can now click the STOP button in the UiPath Studio (top menu bar)
After a few seconds, Studio will return to edit mode.
NOTE: If you enter a non-numeric value by mistake in the User Input box, Studio will pause with an error – simply click the STOP button to return to edit mode.
We now need to look up the data in our Data File (Salary_data.csv).
UiPath has an Activity to help with this called: Read CSV
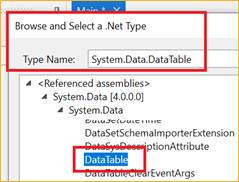
This Activity will load the data from the file into a variable, this variable needs to be of type DataTable.
So create a new variable called salaryData and select type DataTable from the drop down list.
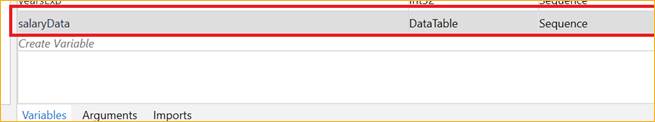
If DataTable is not in the drop down list, then select Browse For Types and search for Type Name: System.Data.DataTable
With the variable created, you can now drag over the Read CSV Activity and place it just below the Message Box.
Remember: Your screens may look slightly different to the images depending on your version of UiPath
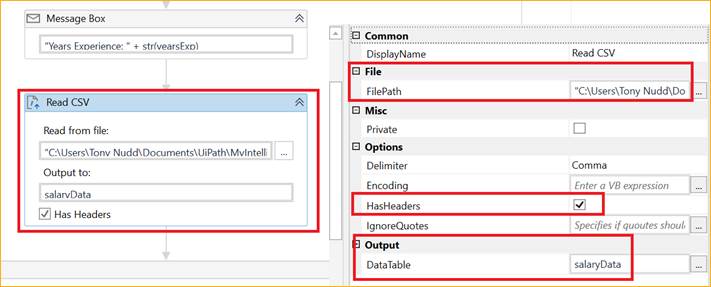
For FilePath – navigate to your Salary_data.csv file
Read CSV Properties:
FilePath: "C:\Users\<Your ID>\Documents\UiPath\MyIntelligentRobot\Salary_data.csv"
Has Headers: Tick (Yes)
Output: salaryData
Now we have our Salary Data loaded in the variable salaryData, we can now loop over each row and grab the values – this is easy using the UiPath Activity For-Each-Row
Search for the Activity For Each Row and drag to under the Read CSV activity.
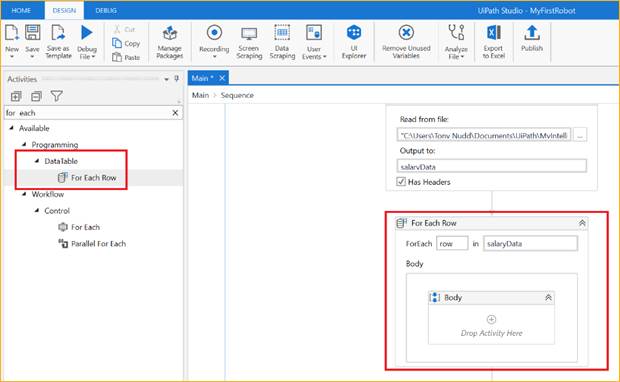
The only property needed here is the name of the DataTable: SalaryData
So now the Activity will loop over each row in our list of data, one by one.
To see what the value of the current row is, we simple call the header name of the column (at the top of the CSV file), and make sure the result is in a text string format:
To make sure (force) the data is of type String we can add the function str()
str(row("YearsExperience"))
or str(row("Salary "))
We will now test each row to see if it matches the value provided by the user (variable yearsExp) again, to ensure this variable is of type string, use the str() function str(yearsExp)
Click the existing IF condition box and drag it inside the BODY of the For Each Row
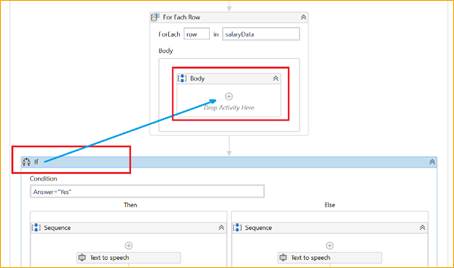
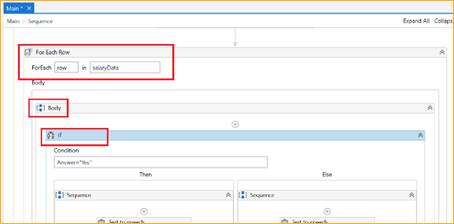
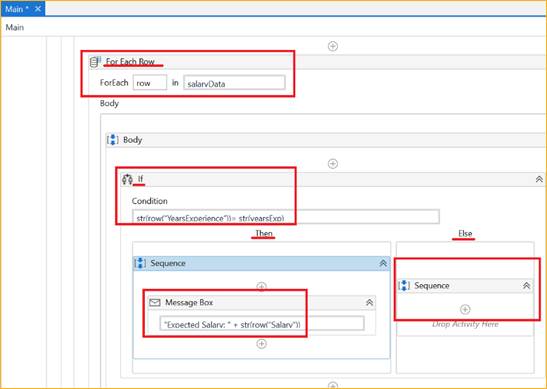
Change the CONDITION to str(row(“YearsExperience”)) = str(yearsExp)
Our condition will be:
·
If the current row YearsExperience
DOES match the years requested by the user (yearsExp),
then display the associated salary information.
·
If we do NOT match, then ignore the result and
go to the next row
· Keep looping until finished.
The IF condition is doing our test – During the For-Each-Row Activity a row in the data file is being read.
IF the requested Years of Experience yearsExp matches that row in the data file row(“YearsExperience”) THEN show the user the Salary value ELSE go to next row.
To get the Salary value in the current row we will use row(“Salary”)
So, we will edit the message in the THEN branch:
“The expected
salary is: $” + str(row(“Salary”))
Remember: When concatenating variables for a Message Box activity, all variables must be of the type “string”. We can use the str() function to force a variable to be of type string.
The ELSE branch does not need to show a message, so we can leave it blank – i.e. delete the existing message box.
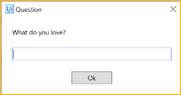
Once all the rows
have been read, then the robot process will move to the old Message Box
and ask “What do you love” – you can press the STOP button in Studio at this
point wait a few seconds for Studio to return
to edit mode.
Let us perform two tests.
Test 1: When asked, enter the number 4, the robot will return two answers:
In other words, in the CSV data table there were two Salary entries for 4 years Work Experience.
Start the Robot

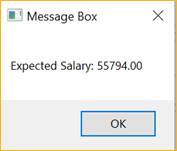
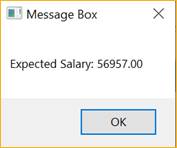
Great – our robot was clever enough to find the information
we needed.
Test 2: When asked, enter the number 10, the robot will return zero answers – and go straight to the “What else do you love” question (i.e. the robot found no matches in the CSV data file).
Start the Robot

Not so good, our robot could not find the information we needed – The robot looked up the information it had access to (Salary_data.csv) and could NOT find 10 years, and therefore could not provide the user with an answer. Our robot is not so clever.
From the file Salary_data.csv, what would you guess the
expected salary could be after 10 years of work experience?
|
Years Experience |
Salary |
|
8.2 8.7 9.0 9.5 9.6 10.1 10.5 |
111832.00 109413.00 105582.00 136969.00 132615.00 142193.00 148872.00 |
A reasonable guess would be about $140,500
If you came up with something similar (bigger than 132615 and lower than 142193) then you would be about right – how did you arrive at your answer?
If our robot was really intelligent, it should be able to predict (determine) what the value for 10 years’ experience is – even though the robot doesn’t actually have access to that value in the data file.
This is what we are going to do, we are going to train our robot on the data available and then using Machine Learning, have our robot make a determination based on the known data (in our CSV file) what an unknown value should be (information not in our CSV file).
The robot is going to make a determination (or prediction) similar to how a human would make a similar determination.
We are going to
creating Artificial Intelligence using Machine Learning.
|
|
What was covered in this section |
·
Reading
values from a CSV file
·
Creating code loops using For-Each-Row
· Using the If-Then-Else Activity
|
|
Test your knowledge |

1.
What is a CSV file format?
2.
Describe what a For-Each-Row activity does?
3.
Describe how the If-Then-Else activity behaves?
4. When concatenating variables together to put in a message, what “data type” must they all be converted into?
|
|
Interesting
Fact Hewlett Packard
Enterprise said it has built the world's largest single-memory computing
system consisting of 160 terabytes. 1 megabyte
equals 1024 kilobytes 1 kilobyte
equals 1,024 bytes 1 byte equals 8
bits 1 bit = 1 or 0 |
|
|
What will be covered in this section |

Creating Artificial Intelligence using Machine Learning and mathematics with Python
|
|
What you will learn |

How mathematics is used by Python functions to create Artificial Intelligence through Machine Learning.
Time: 20 minutes
|
|
Why you need to know it |

Machine Learning can be complex and covers many aspects. This module will introduce a simple Machine learning concept – Linear Regression. All Machine Learning is based on mathematical principals, luckily a lot of the complexity has been removed through Python functions and libraries.
|
|
Let’s Get Started |
As you will know, computers are basically number crunchers, they are just very fast calculators.
Artificial Intelligence in its simplest form can be seen as the clever use of mathematics – some of the maths you probably already know. The cool thing about using Python is that the hard maths is already written for you, you just have to know how to call the mathematical functions we need. The UiPath Robots will help coordinate the functions in the correct order and provide a user interface.
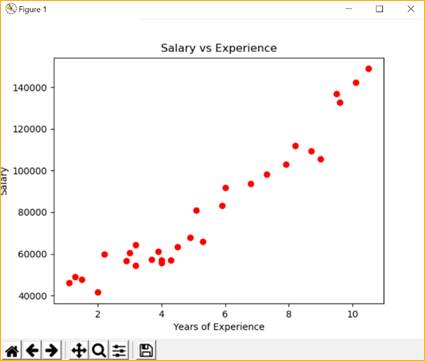
In this tutorial the example we are using is the Salary Amount of Software Robotics Engineer based on the number of years’ experience they have, as shown in the image below
YearsExperience,Salary
1.3,49141.00
1.1,46205.00
1.5,47713.00
2.0,41525.00
2.2,59893.00
2.9,56642.00
3.0,60350.00
3.2,54445.00
3.2,64445.00
3.7,57389.00
3.9,61238.00
4.0,55794.00
4.0,56957.00
4.3,57083.00
4.5,63333.00
4.9,67918.00
5.3,66029.00
5.1,81088.00
5.9,83161.00
6.0,91940.00
6.8,93718.00
7.3,98271.00
7.9,103102.00
8.2,111832.00
8.7,109413.00
9.0,105582.00
9.5,136969.00
9.6,132615.00
10.1,142193.00
10.5,148872.00
If we plot the data in a chart where X-axis =Years (across) and Y-axis=Salary (up) then we get a chart shown in the image. We call the real word collected data the “observed data”.
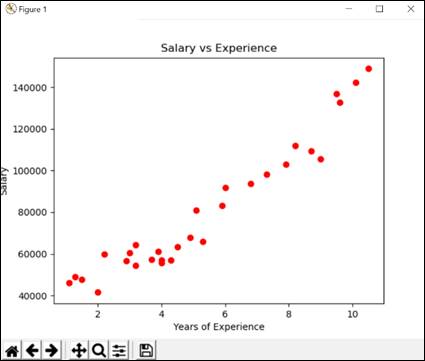
From the graph plotted using the raw data collected we can see a “trend” in the data points (red dots).
The trend is that as the number of years increases, so the salary increases too.
The increase also appears to be fairly constant.
One of the great things about Python is there are many sophisticated libraries we can add to the Python environment which allow us to do complicated things easily – like mathematics.
We are going
to use four special libraries
pandas – Pandas provides
high-performance, easy-to-use data structures and data analysis tools. For
example, pandas allows us to read a CSV file and
import the data into a data table (a bit like the Read CSV Activity in UiPath
Studio).
SciPy – SciPy is built on numpy and contains many functions for Scientific
Calculations.
Matplotlib – Matplotlib allows us to generate
plots, histograms, power spectra, bar charts, error-charts, scatterplots, etc.,
with just a few lines of code
SciKit-Learn - SciKit-Learn is a simple and efficient tool
for predictive data analysis and reusable in various contexts. It is built on
NumPy, SciPy, and MatPlotLib
When we include a library into our code we give it a short easy to use name
e.g. import pandas as pd
Sometimes we do not need to load the whole library (used up lots of memory) so we can add just specific parts of the library. Pyplot is a part of the bigger library matplotlib, we can load just the Pyplot part like this (and give it a short name - plt).
e.g. import matplotlib.pyplot as plt
Even though we can request to load the library in our code, the actual library needs to exist within our Python environment. To do this we use PIP (Python Package Import).
So, we will use PIP to fetch the libraries into our Python environment, then we can import those libararies into our code.
We used PIP in workshop 1.
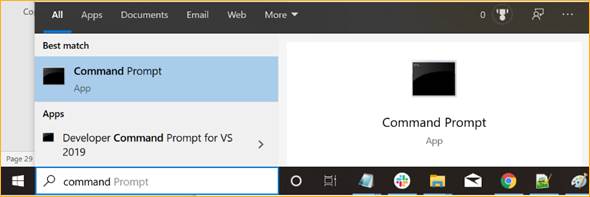
Open a Command Prompt, and then type:
pip install numpy (enter) wait until completed.
Note: If the library is already installed you may get a long message starting with: Requirement already satisfied - If you get this, everything should be okay, go to the next PIP
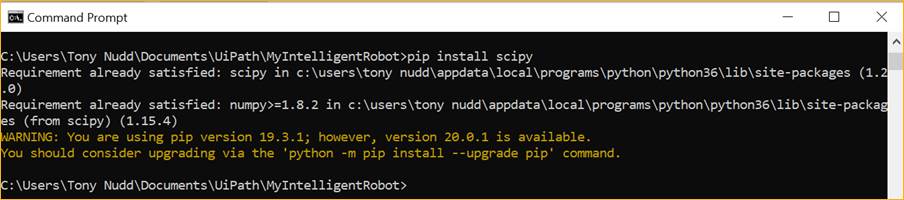
pip install matplotlib (enter) wait until completed.
pip install pandas (enter) wait until completed.
pip install scipy (enter) wait until completed.
pip install scikit-learn (enter) wait until completed.
So, let us use Python to create the chart above so we can visualise (see) the data in a graphical format.
Open Notepad App
Save the empty Notepad file as intelligentml.py
C:\Users\<Your ID>\Documents\UiPath\MyIntelligentRobot\intelligentml.py
Remember to select Save as type: *.*
Add the following lines of code:
# My Python Test
# Author: - use your name here
# Date: 20-01-2020
# Reminder: Indents are four
spaces each time
# Add the needed libraries to
this Python Program
#Add a library (pandas) to do
data analysis and file handling
# Give it a short name (pd)
import pandas as pd
# Add a library (matplotlib) to
do charts and graph plotting
# Just add the features from
matplotlib we need (pyplot)
# Give it a short name (plt)
import matplotlib.pyplot as plt
# Read the row and column data from
our CSV file
# You need to use double \ when describing folder locations in Python
dataset = pd.read_csv('C:\\Users\\<Your ID>\\Documents\\UiPath\\MyIntelligentRobot\\Salary_data.csv')
# Create a set of X and y data
points
X = dataset.iloc[:, :-1].values
y = dataset.iloc[:,1].values
# Visualise the data points in a
scatter chart
# Use the pre-built features from
matplotlib library (plt)
# Make the X-y data points red in
colour
plt.scatter(X, y, color='red')
# Add the title
plt.title('Salary vs Experience')
# Add the X label
plt.xlabel('Years of Experience')
# Add the y label
plt.ylabel('Salary')
# Now set up is complete show the finished chart to the user
plt.show()
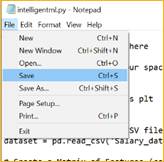
Save the file (FILE – SAVE from Notepad top menu)
Open a Command Prompt
Change Directory to your Project folder
Cd C:\Users\<Your ID>\Documents\UiPath\MyIntelligentRobot
Then run your Python program
C:\Users\<Your ID>\Documents\UiPath\MyIntelligentRobot> python intelligentml.py
![]()
After a few seconds
How easy was that to create the chart!
To close the window, click on the X in the top right-hand side of the chart.
We can observe that there is a relationship between X and y and it seems to be a sloping line going from bottom left to top right.
The data points represent the know data (our robot uses this already in a simple lookup).
What would be cool is if we could average out the datapoints and draw a straight line through them then use the line as a lookup – this way we can determine a result for unknown data too.
The example below shows an imaginary line drawn through the known data points (average out). Looking along this line allows us to make a determination of any value of X (Years Experience).
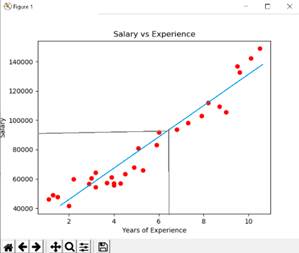
For example, we do not have a data point (a blue dot representing data from Data_salary.csv) for say for 6.5 years. If we use the straight line method (see blue line in diagram above), we could determine 6.5 years’ experience would be about $92,000 (the grey lines are our determination).
If our robot could create that imaginary line and make determination from it – we would now have a super intelligent robot capable of making decisions on data it does not know, but has learnt from what existing data there is.
This is simple Machine Learning, and this is what we will
build next.
|
|
What was covered in this section |
This is a re-cap of what you just covered
|
|
Test your knowledge |
Here are some po-quiz questions to test what you have just covered.
|
|
Interesting
Fact Netflix uses Machine
Learning algorithms to recommend personalised TV shows and movies to its
users. |
|
|
What will be covered in this section |

Behind Machine Learning is mathematics!
While the mathematics can ge very complicated, luckily there are Python libraries which take the hard work away from us. But we still need to know some basics.
|
|
What you will learn |

For our project in this workshop we are using Linear Regression – you will have touched on the mathematics in school and are probably familiar will Linear Equations and how to calculate the slope of a line.
Time: 10 minutes
|
|
Why you need to know it |

|
|
Let’s Get Started |
Okay, if maths is not your thing – you can skip this section and move straight to the
solution.
We can observe that there is a relationship between X and y and it seems to be a sloping line going from bottom left to top right.
If we now draw a straight line through the middle of the observed data points (averaging out the data) to give a “Best Fit” line. This Best Fit line is our “model” of the observed data.
We originally only had 30 or so Observed Data points, but now having drawn our best Fit line we now have a “model” which we can use to predict the salary of any Years of Experience value.
As the Model Data is an averaging out of the Observed (real world) Data, our Salary predictions will be estimates only (or considered as “in the range of” values).
Using the Best Fit line (red) we now have a model to use for the prediction (see the image below)
For example, in our real word Observed Data we did not have a Salary value for two and half years of experience. Now using the Best Fit line, we can predict that the salary for two and half years of experience will be about $50,000
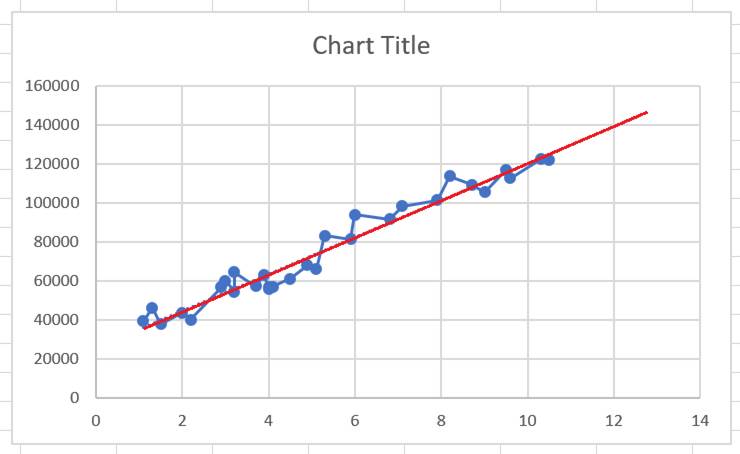
In our Best Fit model, a person with 6 years of experience is “predicted” to be earning about $83,000, however, our Observed Data (see the original data table above) shows that in the real world a person was actually earning $93,940.
So there are some differences between the Observed Data and the Model Data.
Our prediction Model Data comes from the Best Fit line. This line is at the heart of our model for prediction. Let us explore the Best Fit line more.
The formula below calculates a slope on an X-Y axis.
y = b0 + b1 * x1
y = the dependent variable, in this example the Salary (in $ units)
x = the independent variable, in this example experience gained in Years (in Year units)
So, there is an association between the salary and experience gained in Years
b1 = Is the proportion the units change.
That is to say, the amount of change may not be 1:1
I.E. A unit change of one year’s work experience, does not give a one-dollar
unit change in Salary.
b1 is the multiplier needed to use to calculate the actual change.
This concept of “Unit Change” is important.
b0 is a “constant” value.
Notice I the chart that Salary does not start at $0
If we extend the “Best Fit” line so it cuts the Y-axis, we can find our b0
constant.
In this example it appears to be about $25,000
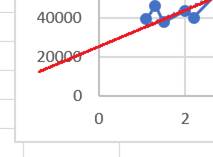
So, we now have:
Salary = 25000 + b1 * Experience
We know that b1 is the proportion that the salary
units change on a change in Years of Experience.
We need to determine how to calculate the proportion of change.
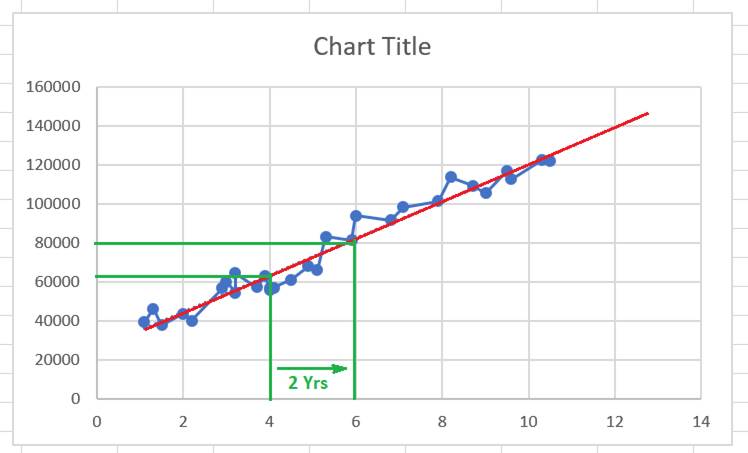
If we draw lines for a particular increase in time as in the
image below, we see a 2 year change (green lines on
the Y-axis between 4 years and 6 years).
We then extend those (green) lines to the X-axis and can calculate the
difference ($80,000 minus $60,000 equals $20,000)
So a 2-year change in Work Experience gives a $20,000 increase in salary.
It would be fair to say then, that based on our raw data plotted in the chart, that for every one-year of work Experience, the RPA Consultant’s Salary increases about $10,000
Notice that the values we used just now are dependent on the slope of the Best Fit line (red line).
Notice that if the Best Fit line was steeper than the Salary increase would be higher for a one year change in Work Experience, and that if the Best Fit line was smaller gradient, then the Salary increase for a one year change in Work Experience would be lower.
If you have been saying to yourself:
“Wait a minute, the values of the data in the examples above are not very accurate, for example the value for a 4-year Salary was not exactly on $60,000, but more line $60,350”
Do not worry, the above is using observational methods and best estimates which is good enough for now.
We will get more accurate soon.
In our model, the Best Fit line (red) we drew earlier is an averaging out of the possible data.
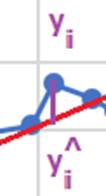
The Best Fit line (red) tells us what the person “should” be earning based on our model (yi).
The Blue Data Point (joined to the red Best Fit model line via the purple line) shows what the “real” Salary value is(yi^).
The purple line is the difference between what the person should be earning (based on our prediction model) from what they are actually earning (based on the observed real world data).
E.g. In our chart we see that for 6 Years of Experience our model suggests (or predicts) that the person should be earning about $82,000 (based on our model), but our real world (observed) data shows that, for that particular person, they are earning around $90,000 (a difference of $8,000 difference).
This difference could be seen as the “error” between our model and the observed data.
The Best Fit line is the line which is at such an angle (or slope) where the error between any Observed Data point and its Model Data point is the least for all data points.
To create a really accurate model (Best Fit Line) there is a mathematical formula we can use.
Basically, we need to calculate for each Observed Data point (blue dot) the difference between the Observed Data (yi the blue dot) and Model Data points (yi^ found via the purple line).
Then square each result.
(yi – yi^)2
Then find the SUM of all those squares in our data.
Then find the minimum value in this new set of data.
SUM(yi – yi^)2 -> min
This is called the “Ordinary Least Squares” Method.
But it could take ages to calculate this especially when
we have thousands or millions of data points to work with.
Do not worry, this is why we
will use a computer program to calculate the Best Fit Line (model) for our
needs.
|
|
What was covered in this section |
This is a re-cap of what you just covered
|
|
Test your knowledge |

Here are some pop-quiz questions to test what you have just covered.
|
|
Interesting
Fact Machine
Learning has beaten the best Chess players and the best Go players. Did you know, after
the first two moves of a Chess game, there are 400 possible next moves. In
Go, there are close to 130,000 possible next moves. |
|
|
What will be covered in this section |
Apply Python Machine Learning code to the data
|
|
What you will learn |

· We will choose our Machine Learning “model” (Linear Regression)
· We will “fit” the ML model to the data
· We will apply the Linear Regression Machine Learning mathematics to get a result - “predict”.
· We will display the results in a chart
· We will create a Python Function to call the ML
· We will get UiPath RPA to call the new function
Time: 35 minutes
|
|
Why you need to know it |

Not only do you need to get hands on with the Python code, but we introduce some new concepts “object”, “model”, “fit”. Each of these terms is used widely in computing.
|
|
Let’s Get Started |
This is where you actually do the activities
Okay, the mathematics is over, let us build a machine Learning Robot.
We are going to take the known data from the Salary_data.csv and split it into two parts.
One part will used as a Training Set, so our robot can “learn” what the imaginary line needs to be.
The other part will be used as a Test Set, so we can test if the robot is making correct determinations based on known data. If the Tests are good, we can be confident the determinations on unknown data will be good too.
This sounds complicated, but luckily the sklearn
library has everything we need to make it easy. The library has a feature
called train_test_split which we will use. So,
add the following line of code to import that feature.
Add the following code:
# Now import the Python Machine
Learning library (scikit_learn)
# Create the Test and Training
Sets using the feature train_test_split
from sklearn.model_selection import train_test_split
We are taking one-third of the known data and will use it as Test Data, the rest is used to Train the robot.
So, we are creating several sets of data:
·
X_train
·
X_test
·
y_train
· y_test
To create those four data sets using the imported feature train_test_split.
Add the following code:
X_train, X_test, y_train, y_test = train_test_split(X,y,test_size = 1/3, random_state=0)
Now we have our Test and Training Data Sets we can Train our robot. The type of Machine Learning we are using is called Linear Regression and the sklearn library has all the functions and formulae needed to perform Linear Regression calculations. All we need to do is call it in our code.
We will import the Linear Regression feature from the sklearn library.
Add the following code:
# Import the Simple Linear
Regression functions
from sklearn.linear_model import LinearRegression
Now we have access to the LinearRegression
features and functions by importing it, we create a specific instance of it, let us name this specific
instance of LinearRegression ml_calc
Whenever we want to use the features and functions of LinearRegression we simply can now refer to ml_calc
Important: When we create a instance of something in Python, that is also known
as an “object”.
It is also possible to have several “instances” of the same thing, each
independent with their own names.
Add the following code:
# Create an instance of LinearRegression
ml_calc = LinearRegression()
We ca now get LinearRegression to
create the imaginary straight line through the averages of the known data
points. The “object” LinearRegression which we
created above and called ml_calc has several useful
methods (or functions) we can use. One of these methods is called “fit”. We
will “fit” the LinearRegression concepts (or
model) to the data sets.
Add the following code:
# Apply
LinearRegresssion to the Training Sets
# The ML is training
based on observed data
ml_calc.fit(X_train,y_train)
We have now applied the mathematics of LinearRegression to our data (X_train and y_Train).
Then lastly we test the Machine
Learning with our Test Data using the “predict” method also built into LinearRegression object (which was from part of the library
SciPy).
Add the following code:
#
Predicting the Test Results
y_pred = ml_calc.predict(X_test)
· We choose our Machine Learning model – LinearRegression
· We “fit” the model to the data
· We apply the mathematics to get a result “predict”
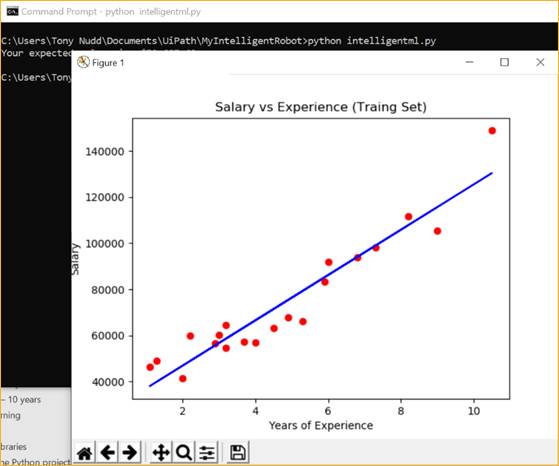
Now we will display the TRAINING Data (red dots) and
the Regression (blue line).
Add the following code:
# Visulaise then Training Set results
plt.scatter(X_train, y_train, color='red')
plt.plot(X_train, ml_calc.predict(X_train), color='blue')
plt.title('Salary vs Experience (Traing
Set)')
plt.xlabel('Years of Experience')
plt.ylabel('Salary')
plt.show()
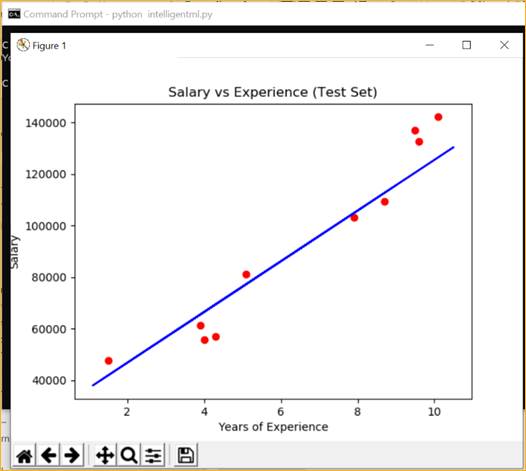
Next, we will display the TEST Data (red dots) and
the Regression (blue line) in a separate chart.
Remember we only used 30% of the known data for testing (so there will be fewer
red dots).
Add the following code:
# Visulaise then Test Set results
plt.scatter(X_test, y_test, color='red')
plt.plot(X_train, ml_calc.predict(X_train), color='blue')
plt.title('Salary vs Experience (Test Set)')
plt.xlabel('Years of Experience')
plt.ylabel('Salary')
plt.show()
Let us test our solution:
In a Command prompt window:
C:\Users\<Your ID>\Documents\UiPath\MyIntelligentRobot>python intelligentml.py
The python reads the Salary_data.csv file, then creates the Test and Train Data Sets.
Then plots and shows the Train Set data (red dots) with the Prediction calculations (blue line)
Then plots and shows the Test Set data (red dots) with the Prediction calculations (blue line)
Close the Chart – Click the top right corner X of the chart window
![]()
The Test Set will then appear
Close the Chart – Click the top right corner X of the chart window
![]()
Your code will end back at the Command Prompt.
Congratulations, you now have the basics of a Machine Learning robot.
Note: Do not copy
and pasted any code in this section until later!
The intelligent Machine Learning robot is however calculating all possible values for the data we have. Previously, we used this is in the code when plotting the chart:
plt.plot(X_train, ml_calc.predict(X_train), color='blue')
We do NOT need every possible calculation, we just want a single Salary result when we pass a single Year value.
To just get one single value we can just call:
<Predicted Salary> = ml_calc.predict(<Years of Experience>)
Let us use a variable called predSalary to hold the Predicted Salary value once it is calculated.
We will hold the desired Years Of Experience value in another variable, called yearExp
Years of Experience is a number which could have a floating point e.g. 2 and a half years would be 2.5
In Python we call this type of number variable a float
So we need to use float(yearExp) so Python knows what type of data it is (data with a decimal point).
If you remember, we passed a data set to our Machine Learning code before, so we need to pass a data set to the mlcalc.predict function too. One way to manually create a data set in Pyhton is to use an “array” – a special variable type which can hold multiple values (including a single value).
So, let us create a variable called empYearExpArray which will eventually hold our single value array.
empYearExpArray = [ ]
Let us now add the first (and only) value into the array (this is called appending), to append we use the format
empYearExpArray.append ( [ ] )
So now we can put our Years of Experience value inside the array
empYearExpArray.append( [ float(yearExp)
] )
Now we have the correct value, in the correct format type, we can call our Machine Learning function:
predSalary = ml_calc.predict(empYearExpArray)
To find out what the result is, we need to read the value inside the predSalary which is also an array.
To really confuse things, the contents in an array are numbered from 0 (i.e. first item is 0 not 1) – so we read the first value in the array:
predSalary[0]
Let us print out the calculated value:
Print(predSalary[0])
You can now copy and paste the following lines of code to your
project:
#
Test a single calculation
yearExp = 2.5
empYearExpArray = []
empYearExpArray.append([float(yearExp)])
predSalary = ml_calc.predict(empYearExpArray)
print(predSalary[0])
Run your project, close each chart as they appear. Now at the Command Prompt window you will get the predicted Salary for 2.5 years:
51743.79439071567
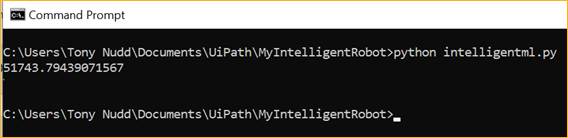
So, our Machine Learning code is working.
The result is a bit too precise – we do not really need to more than 2 decimal points.
Do not make code changes just yet,
just read the following:
So let us format the result predSalary[0] nicely.
We can reduce our result to 2 decimal places by using the round method:
predSalary[0].round(2)
We can format the number to include a comma to separate the thousands:
format( predSalary[0].round(2) , ",")
We will put the nicely formatted result in a variable called salary
salary
= format(predSalary[0].round(2),
",")
Then convert this nicely formatted result to a string type
by using the function str()
str(salary)
Let us
finish by adding some descriptive text and concatenating the two strings
together:
"Your
expected salary is: $" + str(salary)
Put the final text in new variable – salaryText
salaryText = "Your expected salary is:
$" + str(salary)
So, our code changes to:
#
Test a single calculation
yearExp = 2.5
empYearExpArray = []
empYearExpArray.append([float(yearExp)])
salary
= format(predSalary[0].round(2),
",")
salaryText = "Your expected salary is:
$" + str(salary)
You may re-run your code to see the changes, or
continue and create the Python code as Function.
Again, do not make any changes just
yet…
Now change our code to become a Python Function. We will call our function (or method) doML
At the beginning of the program code add the following line:
def doML(yearExp = 1):
This line tells Python we have a function called doML and if no Years of Experience value is passed to it (i.e. if no value for yearExp) then use a default value of 1
Then add four spaces to the beginning of every line
in your code after def doML(yearExp = 1):
The last line we add the return value (i.e. our single calculated
answer in a sentence) return salaryText
A summary of the changes we made above is here:
def doML(yearExp
= 1):
# Add the needed libraries to this Python
Program
#Add a library (pandas) to do data analysis
and file handling
…
more code ….
# Test a single calculation
yearExp = 2.5
empYearExpArray
= []
empYearExpArray.append([float(yearExp)])
predSalary = ml_calc.predict(empYearExpArray)
salary = format(predSalary[0].round(2),
",")
salaryText =
"Your expected salary is: $" + str(salary)
# Send the result back
return salaryText
We no longer need to create the charts, so you can comment out the lines of code for the charts.
We do not need the earlier test value either, so comment out the fixed test value
# Test a single calculation
# yearExp = 2.5
The completed code should look as below - You can
now update your code with the following:
(Remember to check your folder location details)
# My Python Test
# Author: - use your name here
# Date: 20-01-2020
# Reminder” # means a comment, do
not run.
# Reminder: Indents are four
spaces each time
def doML(yearExp
= 1):
# Add the needed libraries to this Python
Program
#Add a library (pandas) to do data analysis
and file handling
# Give it a short name (pd)
import pandas as pd
# Add a library (matplotlib) to do charts
and graph plotting
# Just add the features from matplotlib we
need (pyplot)
# Give it a short name (plt)
import matplotlib.pyplot as plt
# Read the row and column data from our CSV
file
dataset = pd.read_csv('C:\\Users\\<Your ID>\\Documents\\UiPath\\MyIntelligentRobot\\Salary_data.csv')
# Create a set of X and y data points
X = dataset.iloc[:,
:-1].values
y = dataset.iloc[:,1].values
# Now use the Python Machine Learning
library (scikit_learn)
# Create the Test and Training Sets using
the feature train_test_split
from sklearn.model_selection
import train_test_split
X_train, X_test, y_train, y_test = train_test_split(X,y,test_size = 1/3, random_state=0)
# Import the Linear Regression features
(from the library scikit_learn)
from sklearn.linear_model
import LinearRegression
# Create a reusable instance of Linear
Regression (object)
ml_calc = LinearRegression()
# Fit the scikit_learn
Linear Regression model to our Training Set data
# The ML is training based on observed data
ml_calc.fit(X_train,y_train)
# Use the scikit_learn
Predic method on the Test Results
y_pred = ml_calc.predict(X_test)
# Visulaise then
Training Set results
# plt.scatter(X_train, y_train, color='red')
# plt.plot(X_train, ml_calc.predict(X_train), color='blue')
# plt.title('Salary
vs Experience (Traing Set)')
# plt.xlabel('Years
of Experience')
# plt.ylabel('Salary')
# plt.show()
# Visulaise then
Test Set results
# plt.scatter(X_test, y_test, color='red')
# plt.plot(X_train, ml_calc.predict(X_train), color='blue')
# plt.title('Salary
vs Experience (Test Set)')
# plt.xlabel('Years
of Experience')
# plt.ylabel('Salary')
# plt.show()
# Test a single calculation
#yearExp = 2.5
empYearExpArray =
[]
empYearExpArray.append([float(yearExp)])
predSalary = ml_calc.predict(empYearExpArray)
salary = format(predSalary[0].round(2), ",")
salaryText =
"Your expected salary is: $" + str(salary)
return salaryText
We can now call our function from the UiPath software Robot.
Open UiPath Studio
Open your local project
The Python Scope Activity does not need editing, the properties stay the same.
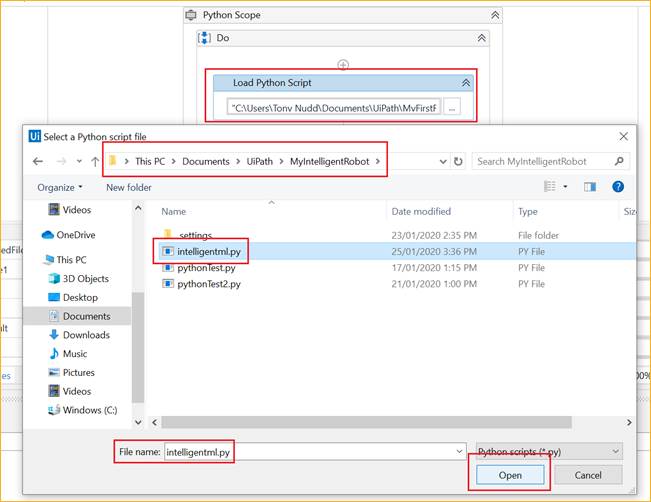
The Load Python Script Activity needs its property pointing to:
C:\Users\Tony Nudd\Documents\UiPath\MyIntelligentRobot\intelligentml.py
The Invoke Python Method needs editing
Properties:
Input parameters: {yearsExp}
Instance: pyLoadedFile - stays same
Name: “doML”
Result: result - stays same
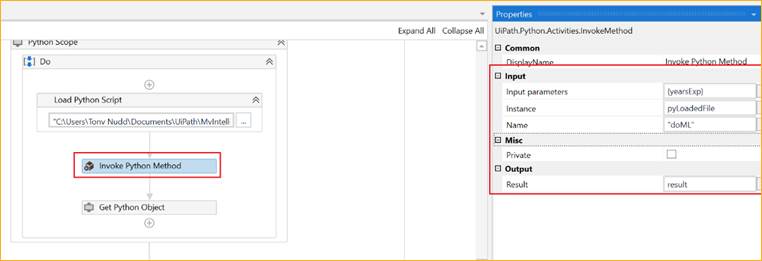
The Get Python Object stays same.
We can also Delete (or Disable) the unused UiPath Activities we no longer need.
We can now also remove the Message Box reminding us
of the Years of Experience value – not needed.
Left-click the Message Box to select it, then right-click the Message Box
Activity and select either Delete (to remove it) or Disable (to ignore it):
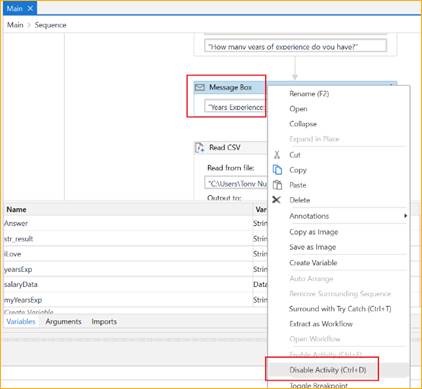
Delete or Disable the Read CSV Activity (Python now does this)
Delete or Disable the For Each Row Activity (Python now does this)
Delete or Disable the Message Box after the For Each Row condition and just before the Python Scope Activity – not needed.
|
|
What was covered in this section |
· We chose our Machine Learning “model” (Linear Regression)
· We did a “fit” of the ML model to the data
· We applied the Linear Regression Machine Learning mathematics to get a result - “predict”.
· We displayed the results in a chart
· We created a Python Function to call the ML
· We set the UiPath Software Robot to call the new Python function
·
We deleted or disabled the unused UiPath
Activities
|
|
Test your knowledge |

Here are some pop-quiz questions to test what you have just covered.
|
|
Interesting
Fact While designing
the Python programming language, designer Guido van Rossum was reading the
published scripts from “Monty Python’s Flying Circus”, a BBC comedy series
from the 1970s. |
|
|
What will be covered in this section |

This is a general introduction to the section and the estimated time it takes to complete
|
|
What you will learn |

This is a summary of what will be covered
|
|
Why you need to know it |

|
|
Let’s Get Started |
Now run the UiPath Robot
Give the Years of Experience you want to find the salary for – let us use a known value (i.e. one in the Salary_data.csv file) e.g. 8.7
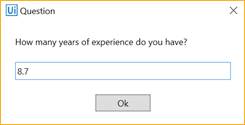
We are expecting a salary of about $109,413.00
We get $112,747.95
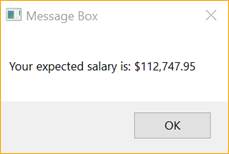
That is a pretty good result – we are happy if the value is “about” what we were expecting.
We can be confident now that our Intelligent Robot is able to make accurate predictions.
You can now test with other values for years of Experience that do NOT exist in the Salary_data.csv file.
|
|
What was covered in this section |
This is a re-cap of what you just covered
|
|
Test your knowledge |

Here are some pop-quiz questions to test what you have just covered.
|
|
Interesting
Fact In March 2017,
Facebook launched an ambitious project to help prevent suicide with
artificial intelligence. It uses a Machine Learning algorithm to detect signs
of potential self-harm in Facebook posts and seeks to proactively address a
serious problem. |
|
|
What will be covered in this section |

This is a general introduction to the section and the estimated time it takes to complete
|
|
What you will learn |

This is a summary of what will be covered
|
|
Why you need to know it |
This explains why it maybe important
|
|
Let’s Get Started |
So just to recap.
The first Software Robot you built was quite clever, it could look up known values for “Years of Experience” and return the expected Salary result. But when given an unknown value for “Years of Experience” the Software Robot could not determine (or predict) an expected Salary.
The first robot is a traditionally programmed Software Robot.
The second design implemented Machine Learning.
We used pre-built Machine Learning algorithms from Python’s sk-learn library.
Notice that the Robot Learnt how to predict a result from the known data.
But adding more correct real-world data to the Salary_data.csv file, the Software Robot will become more accurate because it has more data to learn from.
|
|
What was covered in this section |
|
|
Test your knowledge |

|
|
Interesting
Fact NASA use UiPath
Robots to do the really boring work of processing
Grant Applications. NASA employees no longer have to
do mundane copy and paste work, the UiPath Software Robots do that boring
work so the employees can now get on with the interesting work. |

Congratulations – You have
just built
a UiPath Artificially Intelligent Software Robot using
Machine Learning & Python
This is just one simple AI design
In other workshops, we explore
more UiPath RPA
Artificially Intelligent (AI) projects using
Machine Learning (ML) with Python.
Icons – The icons used in this document were taken from img.pngio.com
Python – All references and images regarding Python belong to www.python.org
UiPath - All references and images regarding UiPath belong to www.uipath.com
Chrome - All references and images regarding Google Chrome belong to www.google.com
MS Office - All references and images regarding Word, Excel and Microsoft Office Google Chrome belong to www.microsoft.com